Nuggets of Information
From the Quagmire of My Mind...
Just somewhere to dump pearls of wisdom (and sometimes other stuff) from a old, tired nerd that's been doing DevOps and related things for FAR to long :)
Data -> Information -> Knowledge -> Wisdom
Climb every mountain...
Abstract
How do I find a specific drop of water in the ocean? How can I notice a particular tree in the forest? How can I gain distinct wisdom from a mountain of data? Monitoring applications provides us insights into how systems are performing and how customers are using products. Monitoring can be a key source of data, and is essential in today’s world, yet is still often overlooked and poorly implemented. Agile principles tell us that we need to do activities continuously - whether that’s building, testing, or generally improving our pipeline through feedback loops. Agile also tells us the feedback loops are important, to tell how we are doing as our application services the customers. Application monitoring is one of the most important feedback loops in DevOps pipelines since it tells you about your application’s performance and health, including the underlying systems. This paper talks about moving up the Data-Information-Knowledge-Wisdom (DIKW) pyramid, and why it might just be worth paying a few bucks for it, instead of pinning your hopes and dreams (and business outcomes!) on simple Nagios checks and tailing logs when you notice something happening in your applications, or on your servers.
The D-I-K-W Pyramid and Application Monitoring
“Sapientia est potentia” – “Wisdom is power”
The concept of “Data - Information - Knowledge - Wisdom” is generally found to have originated from the play The Rock (in “Choruses”) by T. S. Eliot in 1934. The play contains wisdom-knowledge-information in the following lines:
- Where is the Life we have lost in living?
- Where is the wisdom we have lost in knowledge?
- Where is the knowledge we have lost in information?
They say that “wisdom is power”, and that holds true for even application monitoring where organizations today need to take the time to be sure that all the hardware, middleware, and applications in their platform, are accessible and performing smoothly. No one wants a disappointing user experience. An organization’s top priority should be to ensure that their applications are running at their peak efficiency – with minimal downtime – and application monitoring is essential in enhancing the user experiences. Application monitoring can be broken into a few different areas:
- Log Aggregation
- Application Performance Monitoring (APM)
- Metrics gathering
- Visualization
- Real User Monitoring (RUM)
- Metrics from the user perspective
- Client and server side
Event and Incident Management
As you can see in the image above, we want to climb up the pyramid to realize wisdom (and power ) over our systems, and to do that we need to:
- Collect data on our systems
- Transform that data, and capture the information
- Analyze that information, and glean the knowledge
- Enhance the knowledge, to gain the wisdom that it provides
Log Aggregation
Log aggregation tools are used to combine data from multiple sources into one place, in order to derive new insights and discover new relationships and patterns—ideally without losing track of the source data and its lineage. Log aggregation is the practice of gathering up disparate log files for the purposes of organizing the data in them and making them searchable.
The solution here involves several different pieces, each of which has many different tooling options:
Log shipping from source hosts
A very small, resource un-intensive process that reads the logs from the file system, and sends the data to a more centralized (heavy) processor or directly to storage
Log processing (or heavy forwarding)
A heavier process that will process the incoming logs, aggregate them, enhance and process (ETL) and then send them to a storage backend
Data Storage Options
Usually some sort of structured data storage Javascript Object Notation (JSON) format is very popular for raw data storage Can handle processing the logs into more meaningful aggregations and selections on the raw data
Data Visualization Options
Selection of structured stored data by field Aggregations and other transformations of the data Dashboarding to visually represent the processed data into information
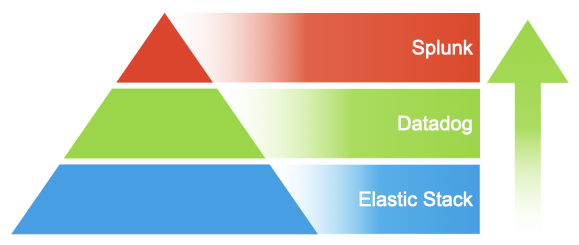
The biggest consideration here is at which level of the pyramid are you wanting to be. As you move up the pyramid in value, you also increase the cost of operation in terms of licensing and raw functionality of the system. The Elastic stack (Elasticsearch for storage, Logstash for aggregation, Beats for log shipping and Kibana for visualization) is a very flexible system, but also has a lot of moving parts and necessary configuration and understanding. Splunk on the other hand only has a few different components, and a much more polished installation and configuration system - as well as functionality built into the system (and available in the GUI) without additional configuration and tooling (like accepting inbound logs over various protocols and configuration of same in the web application). Another aspect that is also true of the APM options (talked about later in this document), is the richness of pre-built dashboards and moving past the raw data into information and knowledge (and even wisdom), which is really where the additional costs are incurred. For most IT shops, you would likely need a team of administrators who are familiar with building out a detailed logging (and later, metrics) solution to configure the lower-level tools, to get the kind of insights into your applications that come much closer out of the box with the more complete (and expensive) commercial solutions. Logging Architectures
Depending on where the logs (and host filesystems) are located, there are different architectures to consider. All four components in the logging solution can be on-premise in the case that you are wanting to have everything hosted in your current datacenter. Another option is a more hybrid solution where the on-premises logs are forwarded from the various hosts to an on-premises heavy forwarder, and then the logs are then processed (enhanced, parsed or dropped) by that heavy forwarder; but then send to a cloud-based service for storage and further analysis.
If the hosts are all out in a public cloud provider, then you can leverage that cloud provider’s log solution (for AWS, there is CloudWatch Logs) or use a forwarding solution to pull the logs from the compute node filesystems and send them into an aggregation solution architecture. Differences between log shippers and log aggregators There is a large difference between a log shipper (light forwarder) where no inspection of the logs is performed, they’re just read and shipped to an aggregator; and the aggregator where data is pulled from several sources, combined into a coherent data stream, and forwarded to a central storage location. Some of the transformational functions that can be performed here are:
- looking up geolocation based on IP addresses in logs
- validating data points captured against other external systems
- combining inbound records together and pre-aggregating metrics
Application Performance Monitoring
User Experience
Application performance monitoring (APM) is a holistic approach for monitoring that allows managing application performance across many diverse computing platforms. This can range from checking if a website is available with a simple ‘ping’ to full synthetic transactions (simulated users) that exercise the application more fully. There has been a significant rise in tooling for this space especially where web applications are concerned, and with this there are significant challenges that come with a user base that can span the globe:
- DNS issues and network connectivity
- Slow servers and loading time
- Poorly written code
- Lack of load balancing
- Traffic spikes
Domain Name Service (DNS) and Network Connectivity
DNS is one of the core, critical infrastructure for web applications as this is how the name “myapp.example.com” is turned into an IP address where the application lives. Faulty DNS queries can prevent visitors from reaching your website, while also causing errors, 404s, and incorrect pathways, which will result in poor user experience and a loss of customers and users. Similarly, network connectivity and an efficient firewall are key parts of your site’s access, security, and productivity. Mitigation of these issues can be accomplished by implementing DNS monitoring safeguards to identify what’s causing potential and actual issues. Checks should also be performed against your critical network components, like switches, VLANs, and ensure that you distribute tasks between nodes and avoid single-points-of-failure (SPF).
Slow Servers and Load Time
If a site is performing poorly, one of the first things to check is the computing nodes and their resources, like CPU, memory, and disk usage. The types of disks used can come into play here as well – flash drives are very much faster than legacy magnetic storage, both of which are still available in the public cloud if not with on-premise computing systems (bare metal or virtual machines). If a compute node is considered “resource bound”, that usually means that the node needs to be rebuilt with larger specifications. This can be optimized for time-to-build by using infrastructure-as-code (IAC) solutions to more automatically provision the systems, and configuration-as-code (CAC) solutions to re-install and/or update the newly rebuilt node. A site is a combination of dynamic data (application) and static resources (images, videos, files, etc.) that are combined to create the final web application that you see in a browser. If a site is loading slowly, it might be loading those static resources (which tend to be quite bigger in size than the dynamic data) from a server that is on a slow network, or one that is a very long distance away. One option here is to move those static resources to a cloud-based cache and that cache is then loaded to various points around the globe. When the user loads the page, the static resources are then loaded from a much closer and faster network.
Poorly Written Code
A common performance issue is either poorly written code or not anticipating user usage patterns. If an application allows you to select an arbitrary amount of data to look at, and on average users only look at the last week - and that’s how the application was designed. Now a user decides to select the last 5 years of data instead, and the server slows down (or in the worst case, crashes), that’s nothing to do with the compute nodes, which could refer to inefficient code, memory leaks, or synchronization issues. Your application could also deadlock due to ineffectual algorithms, as well as the performance degradation of a web application. Old versions of software or integrated legacy systems can also take a toll on your website’s performance. This is a more challenging thing to monitor since you do want to monitor the end-user load times, which generally requires the use of some sort of cloud service to generate requests from various geographies. These “synthetic” transactions are a core offering of several cloud-based monitoring solutions, or you can always roll-your-own by leveraging either AWS Lambdas or similar technology. Challenges around coding practices can also be met by using code analysis tools and continuous improvement or build servers, leveraging unit tests that are automatically run on every commit or push to a repository. Test are of course not a catch-all solution as those tests need to be peer code reviewed along with the source to make sure that the tests are valid and relevant.
Lack of Load Balancing
Slow response times can also be caused by poor load distribution. if all your users are routed to only one of your cluster nodes, then that one node will get overloaded and impact performance, while your other nodes are sitting almost entirely idle. Ensuring that the application architecture takes into account both high-availability (HA) and fault-tolerant principles will help here, and also ensuring that an appropriate load balancing solution is employed. Load balancing is usually performed at layer 4 Transport (of the OSI 7-layer model) or at level 7 Application layer. The benefits of the lower level balancing is a much simpler effort since we’re just balancing protocol-level ports across multiple compute nodes. However, there is not very much intelligence in the balancer, as the only level of information that the balancer can act upon is which port is being accessed by either TCP or UDP: Send traffic to one node or another in a very simple round-robin or ‘weighted’ method (for every 2 requests to server 1, send 1 to server 2) Accept traffic on one port, and send to compute nodes on another port Layer 7 balancers (also called Application Load Balancers) on the other hand are aware of application information being sent to the port, and understand the difference between FTP, HTTP, and HTTPS; the difference between different URLs and URIs of an application. They can also inspect the packet contents and read the data in the body of an HTTP request for instance and act up it. This leads to the ability to affect rules against different aspects of the communication between the user and the server: Automatically switch the user from HTTP to HTTPS to ensure secure communications Detect the type of traffic (user or REST API) and send that traffic to different compute nodes Accept the body of the message and transform it into another message, and forward that to the compute nodes Perform detailed analytics on the packets, and discard those from inappropriate sources
Traffic Spikes
Performance can also be degraded when unexpected patterns of usage occur, like Black Friday or other major traffic surges. This is much more difficult to detect until you’re in the middle of a spike, but having appropriate monitoring in place to track user transactions and processing time can help identify a trend before it becomes an event. This is also where a high-availability (HA) architecture comes into play, where issues of horizontal scaling are considered. The path to success here can be navigated much less painfully with well-architected applications and “elastic” infrastructures, leveraging infrastructure- and configuration-as-code solutions as well as “auto-scaling” solutions that are offered by various public cloud providers.
User Profiles
A key aspect of performance monitoring is to know the users of the system, and how they’re using the system. Different users can be grouped into profiles, each of which will interact with the system in a different way – for instance, a developer will use Jira much differently from a project manager, which will be much different from a system administrator. Understanding how the users are using the system will give you insight into specific usage patterns and points of possible concern, or at least points of the application to keep an eye on.
Key Performance Indicators
Key performance indicators (KPIs) are those data points that indicate key areas of an application, and how they are performing over time. These can be simple numerical measurements (CPU, Memory, Disk) and range to synthetic transactions (simulated user interaction with an application). The types of indicators also live at different levels of the pyramid, where the more simple metrics to measure (like CPU, Memory, and Disk) tend to be lower on the pyramid that more complex synthetic transactions There are also different approaches (or patterns) to watch an application’s performance like observation (no changes to the application, purely watching things from the ‘outside’) or instrumented (in Java for example, where the Java compiled byte code is further enhanced with ‘aspects’ or ‘pointcuts’ to add monitoring logic to existing application code, without affecting the code itself).
Summary
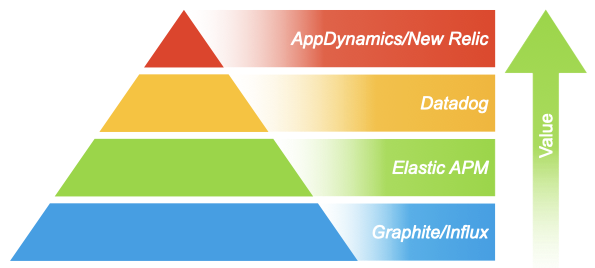
The major differences between the various options in APM tooling tend to be the amount of intelligence built into the tooling, to help you see what you need to see, faster. You can accomplish very close parity to the tools higher on the pyramid with the tools lower on the pyramid, but that will require (sometimes not insignificant) effort. Again, as with the log aggregation tools, while the cost of the tooling may go up as you move upwards in the pyramid, the complexity of the tools themselves and the depth of the tool’s built-in analysis and visualizations will also go up, which then drives the return on investment much higher, and to be realized in the shorter term - instead of having to develop the dashboards and analysis yourself). A particularly nasty challenge to face sometimes is also when you get buried under a mountain of data points, and don’t even know which ones are important or not; which ones may correlate to each other or not. This is where the more polished and complete commercial solutions really shine, as part of what you get is the knowledge and wisdom of WHAT to look at and worry about, and what can be left to the side.
The Wisdom of Hindsight
So now we take our list of problems that we’ve pulled out our applications and systems, like wheat from the chaff, and we start to look at them proactively and realize that we need to fix some of these things. But when? This is now where we connect this feedback loop back to the planning phase (of the DevOps infinity loop). Once we establish this loop back into planning - we reach the summit and start providing wisdom into our applications and systems, and continuously feedback improvements to be planned, built, tested, and deployed, thus strengthening them over time.
Conclusion
Agile and DevOps principles around continuous improvement (using data-driven decisions), make finding the important needles (in the pile of needles) in the haystack important, but the possible impacts on the business or not monitoring your applications and system, make finding them critical. Another important concept to DevOps (and Agile) is ‘Systems Thinking’, which simplified generally means that no one thing lives in a vacuum. Your website sits on someone’s hardware, in someones datacentre, on someone’s network. Is important to know that your website is functioning correctly and servicing your users in a timely manner, and is cost-efficient to run. If you don’t consider monitoring that website correctly, you might not know that your users are experiencing slowdowns, or even worse an outage. It’s easy to “shotgun” monitor everything you possibly can, but then how to can you notice the important bits of information, in that sea of datapoints? And then take that information and create the Knowledge that you need to make things better? How can I apply that hard-earned Knowledge and gain Wisdom into my applications - and business? At the end of the day, you want to climb that D-I-K-W pyramid, and make your business thrive! Adaptavist has extensive experience with many diverse applications, and can help you consider: Are the checks being performed against my applications and systems just showing me Data points, or are they providing me with some Knowledge about my business? Am I capturing time-related data, since numbers going up and down have vastly different meanings depending on how much time was spent going up or down? Am I being as descriptive as possible with captured data, to make the trek up the pyramid as easy as possible Regardless of the tooling chosen for either logs or metrics, make sure that the process that you are following leads you up the DIKW pyramid. And it never hurts to start with Data - we all have to start somewhere, and some information is better than none at all. Without big data analytics, companies are blind and deaf, wandering out onto the Web like deer on a freeway. Geoffrey Moore, Author of Crossing the Chasm & Inside the Tornado If might be quite the trip, but the view from WIsdom’s Peak will only make your applications and systems that much better, and result in a better customer experience for everyone!